Forget Monitoring – Observability Actually Tells You Why Stuff Breaks
Monitoring is fine if you want to know your server is on fire. Observability tells you how, when, and why the fire started – and whether your logs are lying to you. If you’re still using old-school dashboards that flash red when something’s already exploded, you’re missing half the story.
Observability platforms are a set of tools and practices that give you deep visibility into your systems, letting you understand not just what went wrong, but why it happened, so you can actually fix it before your CFO finds out.
What Are Observability Platforms Really?
Observability isn’t just “advanced monitoring.” It’s a way to actually answer questions about your software stack – before, during, and after things go sideways. At their core, observability platforms are systems that collect, correlate, and analyze telemetry data – like logs, metrics, and traces – from across your infrastructure.
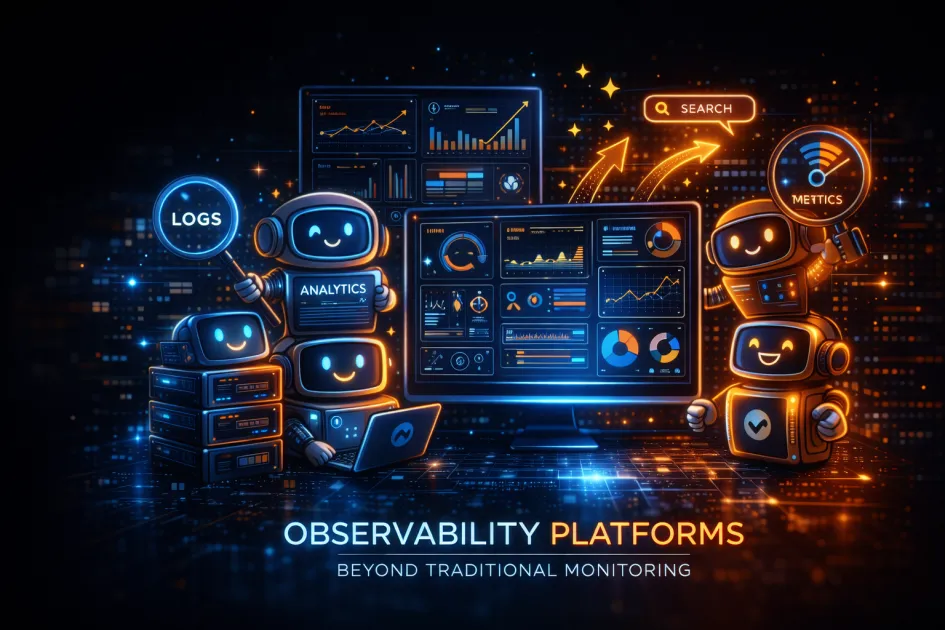
Here’s what typically makes up an observability platform:
- Tracing: Follows a request through every microservice, container, or Kafka topic it touches. If you can’t tell where things slow down, tracing is your friend.
- Metrics: Numeric data over time – think CPU usage, memory, latency. You know, the stuff that makes dashboards look “busy.”
- Logs: The text scribbles left behind by your applications. Not just forensics – when parsed right, they’re a goldmine.
- Correlation Engine: The secret sauce that ties all the above together, so you see the big picture instead of a pixelated mess.
If your tool just shows a graph, it’s not observability. If it tells you why traffic dropped at 2 AM and which database query is to blame, that’s observability.
Definition Box:
- Observability Platform: A system for collecting, correlating, and analyzing diverse telemetry data (logs, metrics, traces) to answer complex questions about software behavior and performance.
How Observability Platforms Work – Under the Hood
No, they’re not powered by magic elves. Observability platforms rely on a few key building blocks:
- Telemetry Collection: Agents and SDKs gather data from your apps, cloud services, and infrastructure. Think OpenTelemetry, Prometheus, or Jaeger.
- Data Ingestion & Storage: Streams of telemetry data get shipped to a central store – cloud or on-prem, doesn’t matter, as long as it scales.
- Correlation & Context: The platform stitches together logs, traces, and metrics into a single timeline. Suddenly, that 500 error isn’t just noise – it’s a clue.
- Visualization & Alerting: Dashboards, anomaly detection, and custom alerts. Less time staring at graphs, more time fixing actual problems.
What sets a real observability stack apart? Context. If your alert doesn’t show you which release caused the mess, or which pod started leaking memory, you’re not getting your money’s worth.
Monitoring vs. Observability (No, They’re Not the Same)
| Feature | Traditional Monitoring | Observability Platform |
|---|---|---|
| Scope | Predefined metrics, static dashboards | Dynamic, exploratory, real-time questions |
| Data Types | Mostly metrics, maybe some logs | Metrics, logs, traces, events, dependencies |
| Root Cause Analysis | Manual, slow, guesswork | Automated, correlated, contextual insights |
| Flexibility | Alert on what you already know | Explore unknown unknowns |
Why Observability Platforms Matter (And Why You’ll Regret Skipping Them)
“Why bother if my monitoring works?” Because your five-alarm Slack channel isn’t helping anyone sleep. Here’s what observability brings that monitoring can’t:
- Faster Incident Response: Find the real problem, not just the symptom. Stop playing “blame the network.”
- Proactive Problem Solving: Spot weird patterns before they turn into outages. Yes, predictive analytics are actually useful here.
- Better DevOps Collaboration: Give devs and ops the same facts, not different dashboards and finger-pointing sessions.
- Modern Infrastructure Ready: Works with containers, Kubernetes, cloud-native apps, microservices. If you’re still running everything on one box, congratulations – you’re a museum piece.
- Compliance & Audit: Trace every transaction for security, compliance, and that inevitable “who changed what” post-mortem.
If you’re building anything more complicated than a static website (and let’s be honest, even those break), observability is the difference between surviving production and living in chaos.
Common Mistakes and How to Dodge Them
Here’s where most teams trip up:
- Thinking logs are enough. They’re not. Without traces, you’ll be lost in a haystack.
- Tool overload. Gluing together six open-source projects with duct tape isn’t a strategy.
- Ignoring cardinality. High-cardinality data (unique IDs everywhere) can crush your storage and budget. Use tools that handle this gracefully.
- Alert fatigue. If your phone pings for every minor spike, you’ll start ignoring the real issues.
- Not instrumenting code. If you’re not adding the right hooks, even the best platform is blind.
Pro tip: Start small, focus on high-impact services, and expand from there. Don’t try to “observabilitize” your entire stack in one sprint.
Best Practices for Getting Real Value from Observability
- Standardize on OpenTelemetry or similar frameworks. Don’t get locked into one vendor’s weird format.
- Automate anomaly detection. Machines are better at spotting weirdness at 3 AM than you are.
- Correlate releases with incidents. If a deploy goes out and your error rate spikes, that’s not a coincidence.
- Invest in usable dashboards. If the UI looks like a cockpit, your team will never use it.
- Integrate with incident management tools like PagerDuty or Opsgenie. Otherwise, enjoy your sleepless nights.
Practical Steps to Start Using Observability Platforms
- Pick a platform that supports your stack: Datadog, New Relic, Honeycomb, or roll your own with open-source tools.
- Instrument your code for traces and metrics – don’t just rely on “out of the box” integration.
- Set up baseline alerts, but tune aggressively to avoid noise.
- Correlate your logs, metrics, and traces. If they’re in silos, you’re still flying blind.
- Review incidents and improve – observability is a process, not a checkbox.
FAQ
What’s the difference between observability and monitoring?
Monitoring tells you something’s wrong; observability helps you figure out why. Monitoring is for known issues. Observability is for the surprises.
Can I build my own observability platform?
Sure, if you enjoy maintaining 17 open-source components and explaining to finance why your storage bill tripled. Most teams use a mix of open-source and managed platforms.
Is observability only for microservices?
No. It’s critical for microservices, but any modern app – cloud, hybrid, even on-prem – benefits from real observability.
How do I choose the right observability tool?
Look for support for your tech stack, good correlation features, cost transparency, and actual usability. Ignore shiny dashboards if the alerts are garbage.
What are some common observability use cases?
Root cause analysis, performance tuning, compliance audits, anomaly detection, and keeping devs and ops from flipping tables during outages.
Final Thoughts
If you’re still clinging to traditional monitoring, you’re one outage away from chaos. Observability platforms give you answers, not just alerts. Go beyond “the server is down” – figure out why, fix it fast, and maybe get some sleep.