

Disclosure: As an Amazon associate, I may earn from qualifying purchases
Due to the rapid influx of data, statistical analysis has become a key component of data science initiatives. To make sense of the data and draw conclusions from it, statistical approaches have become more crucial as data sets have gotten bigger and more complicated.
Data scientists may confidently make judgments based on data by using statistical analysis, which provides a framework for analysing data and testing hypotheses.
Data science projects frequently employs methods like clustering analysis, hypothesis testing, and regression analysis to find patterns, correlations, and trends in the data.
Additionally, statistical analysis can aid in reducing the risk associated with making decisions based on inaccurate or biassed data. Data scientists can make sure that their results are supported by rigorous analysis and not just anecdotal evidence or personal biases by applying statistical tools to assess the data.
Overall, statistical analysis has evolved into a decisive part of data science, offering a methodical and comprehensive way of interpreting data that can be used to drive business decisions and inform policy-making.
Table of Contents
Introduction to Statistical Analysis in R
Due to its extensive collection of statistical functions and libraries, R is frequently used in data science for statistical analysis.
Base R, stats, and tidyverse are a few examples of built-in functions or packages in R that can be used to perform this step.
To begin a statistical analysis, it is necessary to comprehend the data and establish what the research topic is.
After this, the data can be condensed using descriptive statistics like mean, median, mode, standard deviation, variance, and range. These statistics give a fundamental comprehension of the data and aid in spotting any potential trends or outliers.
To find out whether a specific hypothesis is supported by the data, hypothesis testing can then be done.
A null hypothesis and an alternative hypothesis must be developed before applying statistical techniques to calculate the likelihood that the data will be observed if the null hypothesis is correct.
Regression analysis, t-tests, ANOVA, chi-square tests, and other common statistical tests are frequently employed in hypothesis testing.
Built-in R functions like t.test() for t-tests and lm() for linear regression analysis can be used to conduct statistical analysis. Prior to this, data can be wrangled and cleaned using packages like dplyr and tidyr.
Another crucial component of statistical analysis in R is visualization. To visually analyse the data and find trends or outliers, plots like scatter plots, box plots, and histograms can be employed. R offers a number of packages for doing this – including ggplot2, lattice, and base graphics.
Overall, statistical analysis is an important stage in data science, and R provides a powerful set of tools for performing this procedure. R
is a popular choice among data scientists and analysts because of its extensive set of built-in functions and libraries, which can be used to carry out a wide range of statistical tests and analyses.
Using Inferential Statistics to draw Conclusions from Data
We may derive information about a population from a sample of data using inferential statistics, a potent tool in data science. Making inferences about the population from which the sample was taken is the purpose of inferential statistics.
Estimation and hypothesis testing are both a part of this valuable process.
A null hypothesis and an alternative hypothesis must be formulated before applying statistical techniques to calculate the likelihood that the data will be observed if the null hypothesis is correct.
The null hypothesis is rejected and the alternative hypothesis is accepted if the likelihood is sufficiently low (usually less than 5%).
The process of estimation entails calculating population metrics like the mean or proportion using the sample data. The degree of uncertainty in the estimated parameter is expressed in terms of confidence intervals.
If we repeated the sample procedure many times, for instance, a 95% confidence interval would indicate that 95% of the intervals would contain the real population parameter.
It is possible to perform inferential statistics using built-in R functions or packages like stats and infer.
For running hypothesis tests, R offers a variety of functions, including t.test() for t-tests and chisq.test() for chi-square tests.
For more complicated scenarios involving hypothesis testing, tools for bootstrap and permutation tests are available in the infer package.
Inferential statistics also emphasises visualization as a key component. To compare the distribution of the sample data to the predicted distribution of the population, graphs like box plots and density plots can be utilised.
For data visualisation, R has a number of libraries, including ggplot2 and lattice.
Inferential statistics, as a whole, is an effective technique for deriving generalizations about populations from sample data.
R is a popular pick among data scientists and analysts because of its extensive set of built-in functions and libraries, which can be used to conduct a wide range of analytical tests from statistical models.
Conducting Regression Analysis with R
Analysis of the relationship between a dependent variable and one or more independent variables is done statistically using regression analysis.
The modelling and prediction of a dependent variable’s behavior using one or more independent variables is a frequent practice in data science.
Regression analysis is possible in R by utilizing built-in functions like lm() for linear regression and glm() for generalized linear regression.
The glm() function can be used to fit models with non-normal distributions or non-linear relationships, while the lm() method can be used to fit linear models.
Before conducting regression analysis, it is important to clean and preprocess the data using tidyverse functions such as select(), filter(), and mutate(). Missing data should also be handled appropriately using functions such as na.omit() or complete.cases().
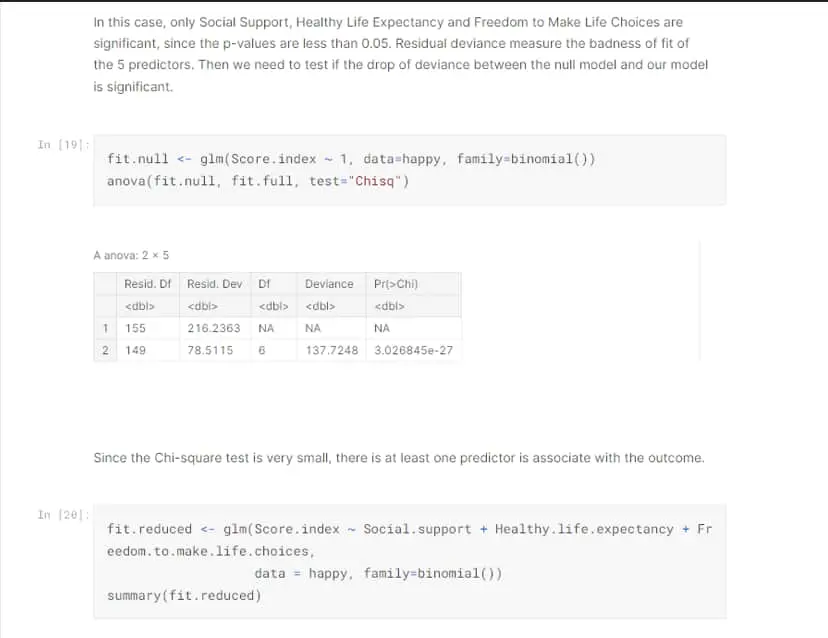
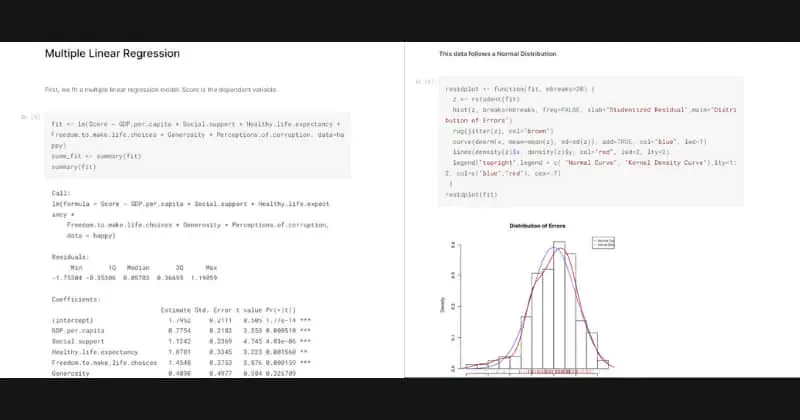
The lm() or glm() function can be used to fit regression models after the data have been prepared. The results of the regression analysis, including the estimated coefficients, standard errors, and p-values, can be obtained using the summary() function.
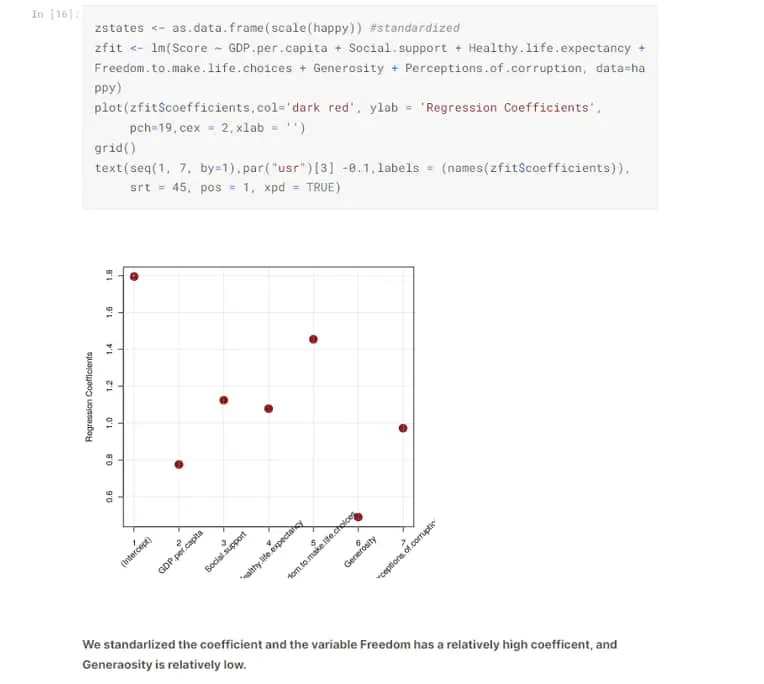
Another major element of regression analysis in R is visualization. You may visually evaluate the relationship between the dependent variable and the independent variables as well as the regression model’s quality of fit by using plots like scatter plots and residual plots.
Overall, regression analysis is a robust data science methodology, and R offers a wide range of functions and packages to help with the process.
R is a widely-liked option among data scientists and analysts for performing this technique because it comes with built-in functions for linear and generalised linear regression as well as libraries for data visualization.
Once valuable insights from data have been extracted and analysed, we can build machine learning models that can use this processed information to learn automatically and make predictions in real time.
The modelling and prediction of a dependent variable’s behavior using one or more independent variables is a frequent practice in data science.
Regression analysis is possible in R by utilizing built-in functions like lm() for linear regression and glm() for generalized linear regression.
The glm() function can be used to fit models with non-normal distributions or non-linear relationships, while the lm() method can be used to fit linear models.
Before conducting regression analysis, it is important to clean and preprocess the data using tidyverse functions such as select(), filter(), and mutate(). Missing data should also be handled appropriately using functions such as na.omit() or complete.cases().
The lm() or glm() function can be used to fit regression models after the data have been prepared. The results of the regression analysis, including the estimated coefficients, standard errors, and p-values, can be obtained using the summary() function.
Another major element of regression analysis in R is visualization. You may visually evaluate the relationship between the dependent variable and the independent variables as well as the regression model’s quality of fit by using plots like scatter plots and residual plots.
Overall, regression analysis is a robust data science methodology, and R offers a wide range of functions and packages to help with the process.
R is a widely-liked option among data scientists and analysts for performing this technique because it comes with built-in functions for linear and generalised linear regression as well as libraries for data visualization.
Once valuable insights from data have been extracted and analysed, we can build machine learning models that can use this processed information to learn automatically and make predictions in real time.